This graph features a history of global surface temperatures that combine measurements from as far back as 800,000 years up to the present. Select a greenhouse gas from the graph menu to compare temperature to historical carbon dioxide, methane and nitrous oxide levels. The graph is customizable and can be resized, printed, or pasted into your website. This is a free service, but we do ask for a donation if you find this useful. This is a project of the 2 Degrees Institute, a non-profit organization.

![]() Global temperatures reconstructed by taking a spatially-weighted average of 59 proxy sea surface
temperature records from around the global oceans. All records span the last 150,000 years, but the
dataset degrades to approximately 10 records by 800,000 years ago. The reconstruction has been scaled
to have a glacial-interglacial range of 4°C based on more comprehensive datasets suggesting that this
was the likely magnitude of ice age cooling (Annan and Hargreaves, 2013, Climate of the Past).
Global temperatures reconstructed by taking a spatially-weighted average of 59 proxy sea surface
temperature records from around the global oceans. All records span the last 150,000 years, but the
dataset degrades to approximately 10 records by 800,000 years ago. The reconstruction has been scaled
to have a glacial-interglacial range of 4°C based on more comprehensive datasets suggesting that this
was the likely magnitude of ice age cooling (Annan and Hargreaves, 2013, Climate of the Past).
Base period for temperature anomaly: 1951-1980 as per source NASA GISS GLOBAL Land-Ocean Temperature Index
Credits: Snyder, C.W. 2016. Evolution of global temperature over the past two million years. Nature, Vol. 538, pp. 226-228.
")
![]() Global temperatures reconstructed by averaging well-dated, calibrated proxy temperature records from around the world, mostly from ocean margin sediment cores, in addition to lake and ice cores on land. 80 records span the last deglaciation and 73 records cover the Holocene. This reconstruction smooths out shorter-term variability due to the relatively low resolution of the records and chronological uncertainties, but reliably captures centennial and millennial-scale features. The reconstruction has been scaled to have a glacial-interglacial range of 4°C based on more comprehensive datasets suggesting that this was the likely magnitude of ice age cooling (Annan and Hargreaves, 2013, Climate of the Past).
Global temperatures reconstructed by averaging well-dated, calibrated proxy temperature records from around the world, mostly from ocean margin sediment cores, in addition to lake and ice cores on land. 80 records span the last deglaciation and 73 records cover the Holocene. This reconstruction smooths out shorter-term variability due to the relatively low resolution of the records and chronological uncertainties, but reliably captures centennial and millennial-scale features. The reconstruction has been scaled to have a glacial-interglacial range of 4°C based on more comprehensive datasets suggesting that this was the likely magnitude of ice age cooling (Annan and Hargreaves, 2013, Climate of the Past).
Base period for temperature anomaly: 1951-1980 as per source NASA GISS GLOBAL Land-Ocean Temperature Index
Credits:
Marcott, S.A., J.D. Shakun, P.U. Clark, and A.C. Mix. 2013. A reconstruction of regional and global temperature for the past 11,300 years. Science, Vol. 339. pp. 1198-1201. doi:10.1126/science.1228026.
Shakun, J.D., P.U. Clark, F. He, S.A. Marcott, A.C. Mix, Z. Liu, B.L. Otto-Bliesner, A. Schmittner, A., and
E. Bard. 2012. Global warming preceded by increasing carbon dioxide concentrations during the last
deglaciation. Nature, Vol. 484, pp. 49-54. doi:10.1038/nature10915.

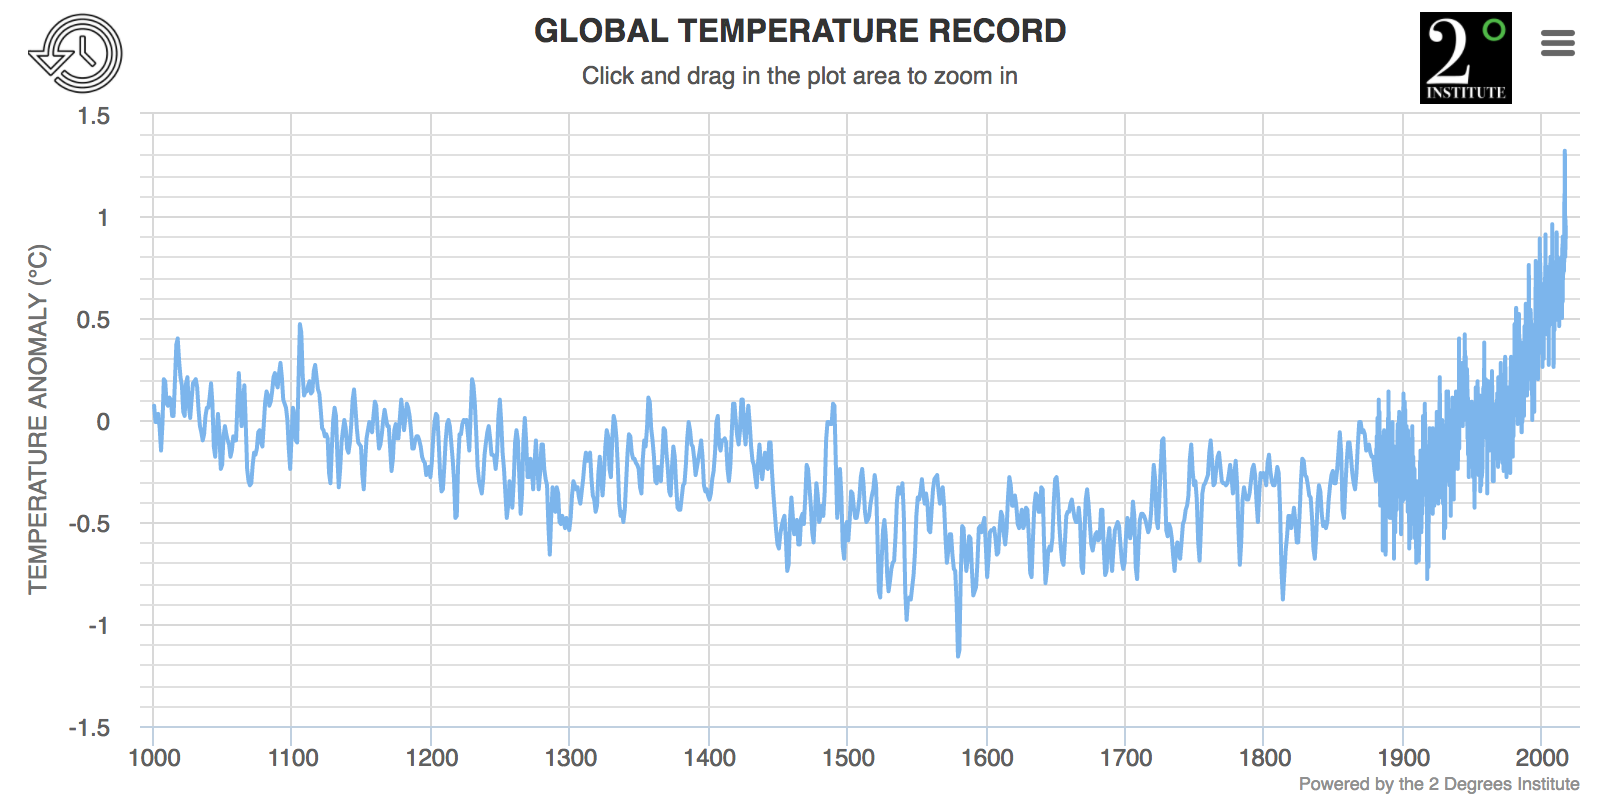
![]() Northern Hemisphere temperatures reconstructed by statistically combining long-term fluctuations
recorded by 11 low-resolution proxy series (lake and ocean sediments, ice cores, stalagmites) and short-
term variations recorded by 7 tree-rings series. The reconstruction was calibrated by matching its mean
and variance to the instrumental record of Northern Hemisphere annual mean temperature over the
period of overlap (CE 1856-1979).
Northern Hemisphere temperatures reconstructed by statistically combining long-term fluctuations
recorded by 11 low-resolution proxy series (lake and ocean sediments, ice cores, stalagmites) and short-
term variations recorded by 7 tree-rings series. The reconstruction was calibrated by matching its mean
and variance to the instrumental record of Northern Hemisphere annual mean temperature over the
period of overlap (CE 1856-1979).
Base period for temperature anomaly: 1951-1980 as per source NASA GISS GLOBAL Land-Ocean Temperature Index
Credits: Moberg, A., D.M. Sonechkin, K. Holmgren, N.M. Datsenko, and W. Karlén. 2005. Highly variable Northern Hemisphere temperatures reconstructed from low- and high-resolution proxy data. Nature, Vol. 433, pp. 613-617.
")
![]() GISS Surface Temperature Analysis:
The basic GISS temperature analysis scheme was defined in the late 1970s by James Hansen when a method of estimating global temperature change was needed for comparison with one-dimensional global climate models. The scheme was based on the finding that the correlation of temperature change was reasonably strong for stations separated by up to 1200 km, especially at middle and high latitudes. This fact proved sufficient to obtain useful estimates for global mean temperature changes.
GISS Surface Temperature Analysis:
The basic GISS temperature analysis scheme was defined in the late 1970s by James Hansen when a method of estimating global temperature change was needed for comparison with one-dimensional global climate models. The scheme was based on the finding that the correlation of temperature change was reasonably strong for stations separated by up to 1200 km, especially at middle and high latitudes. This fact proved sufficient to obtain useful estimates for global mean temperature changes.
Combined land-surface air and sea-surface water temperature anomalies data is updated around the middle of every month and combines data files from NOAA GHCN v4 (meteorological stations) and ERSST v5 (ocean areas). The GLOBAL Land-Ocean Temperature Index is used.
Base period for temperature anomaly: 1951-1980 as per source NASA GISS GLOBAL Land-Ocean Temperature Index
Credits: Lenssen, N., G. Schmidt, J. Hansen, M. Menne,A. Persin,R. Ruedy, and D. Zyss, 2019: Improvements in the GISTEMP uncertainty model. J. Geophys. Res. Atmos., 124, no. 12, 6307-6326, doi:10.1029/2018JD029522.

Dr. Pieter Tans
NOAA's Earth System Research Laboratory

Dr. Jeremy Shakun
Boston College

Dr. Geoff Dutton
NOAA's Earth System Research Laboratory
Dr. Ed Dlugokencky
NOAA's Earth System Research Laboratory